Walkmap
Help inter-MSA movers understand their new city's neighborhoods
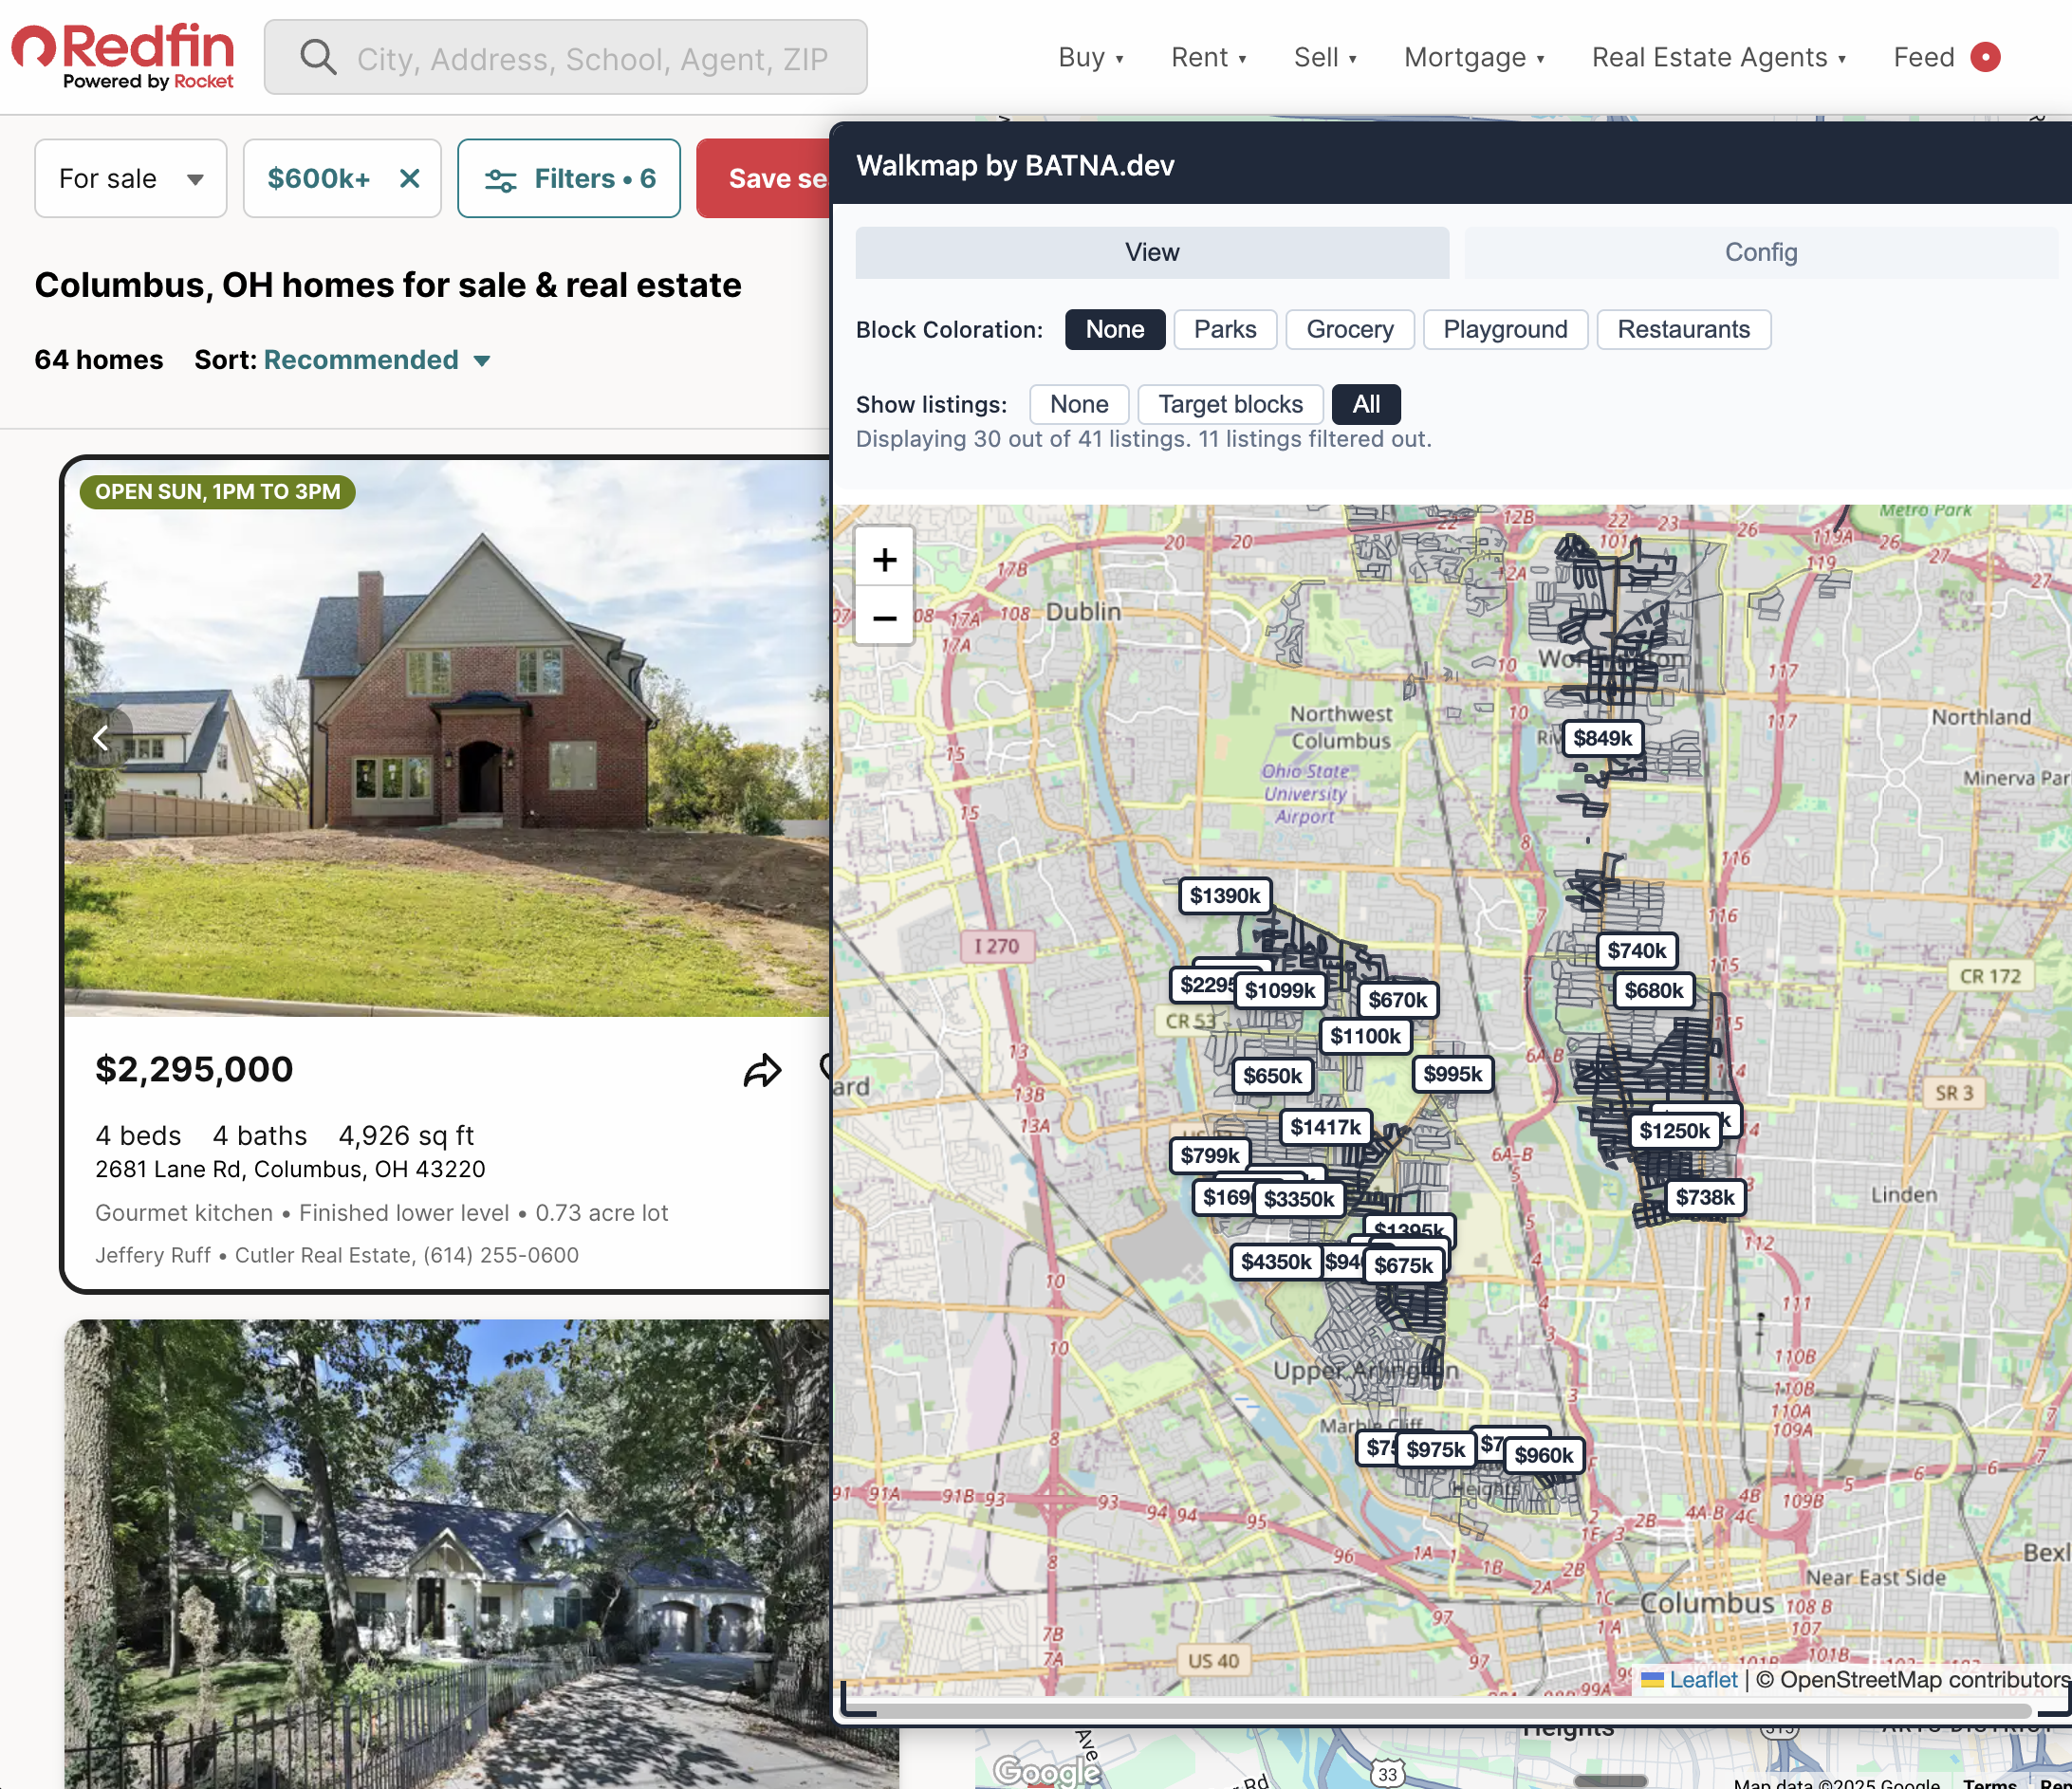
Frustrated by one-size-fits-all "Walk Scores" and "neighborhood scores", I built my own. WalkMap is a configurable heat map of amenities movers care about—grocery stores, parks, playgrounds, restaurants. Once I got it highlighting parts of the city, I integrated it with Redfin's listings payload so I can see the walkability for each new listing. Finally I packaged it up as a Chrome extension so I could share it with others.
This first iteration is focused exclusively on Columbus, OH. I wrote scripts to import data from arcGIS and OpenStreetMap to power the live block criteria evaluation. Based on YAGNI, these scripts and the current database were built assuming a single market.
That being said this type of evaluation could be interesting to scale up. According to the US Census's American Community Survey (dataset K200701), the top 20 MSAs by gross interstate in-migration wecomed over 2.5 million people in 2023.
Interstate migration, historically associated with economic mobility, has been declining in recent years — from 16.8% of the population in 2006 to 13.7% in 2019. Interstate migration has stayed a relatively flat proportion of total movers (16.6% of movers in 2006 and 17.4% in 2019). Tools that make these big moves easier for people can help make the pie of movers bigger.